M6vsM5
| Test | M6 | M5 | Diff |
|---|---|---|---|
| GB7 single | 4,004 | 3,649 | +10% |
| GB7 multi | 21,868 | 17,951 | +22% |
| GB7 Metal | 89,357 | 72,805 | +23% |
| CB2026 single | 824 | 737 | +12% |
| CB2026 multi | 5,705 | 4,367 | +31% |
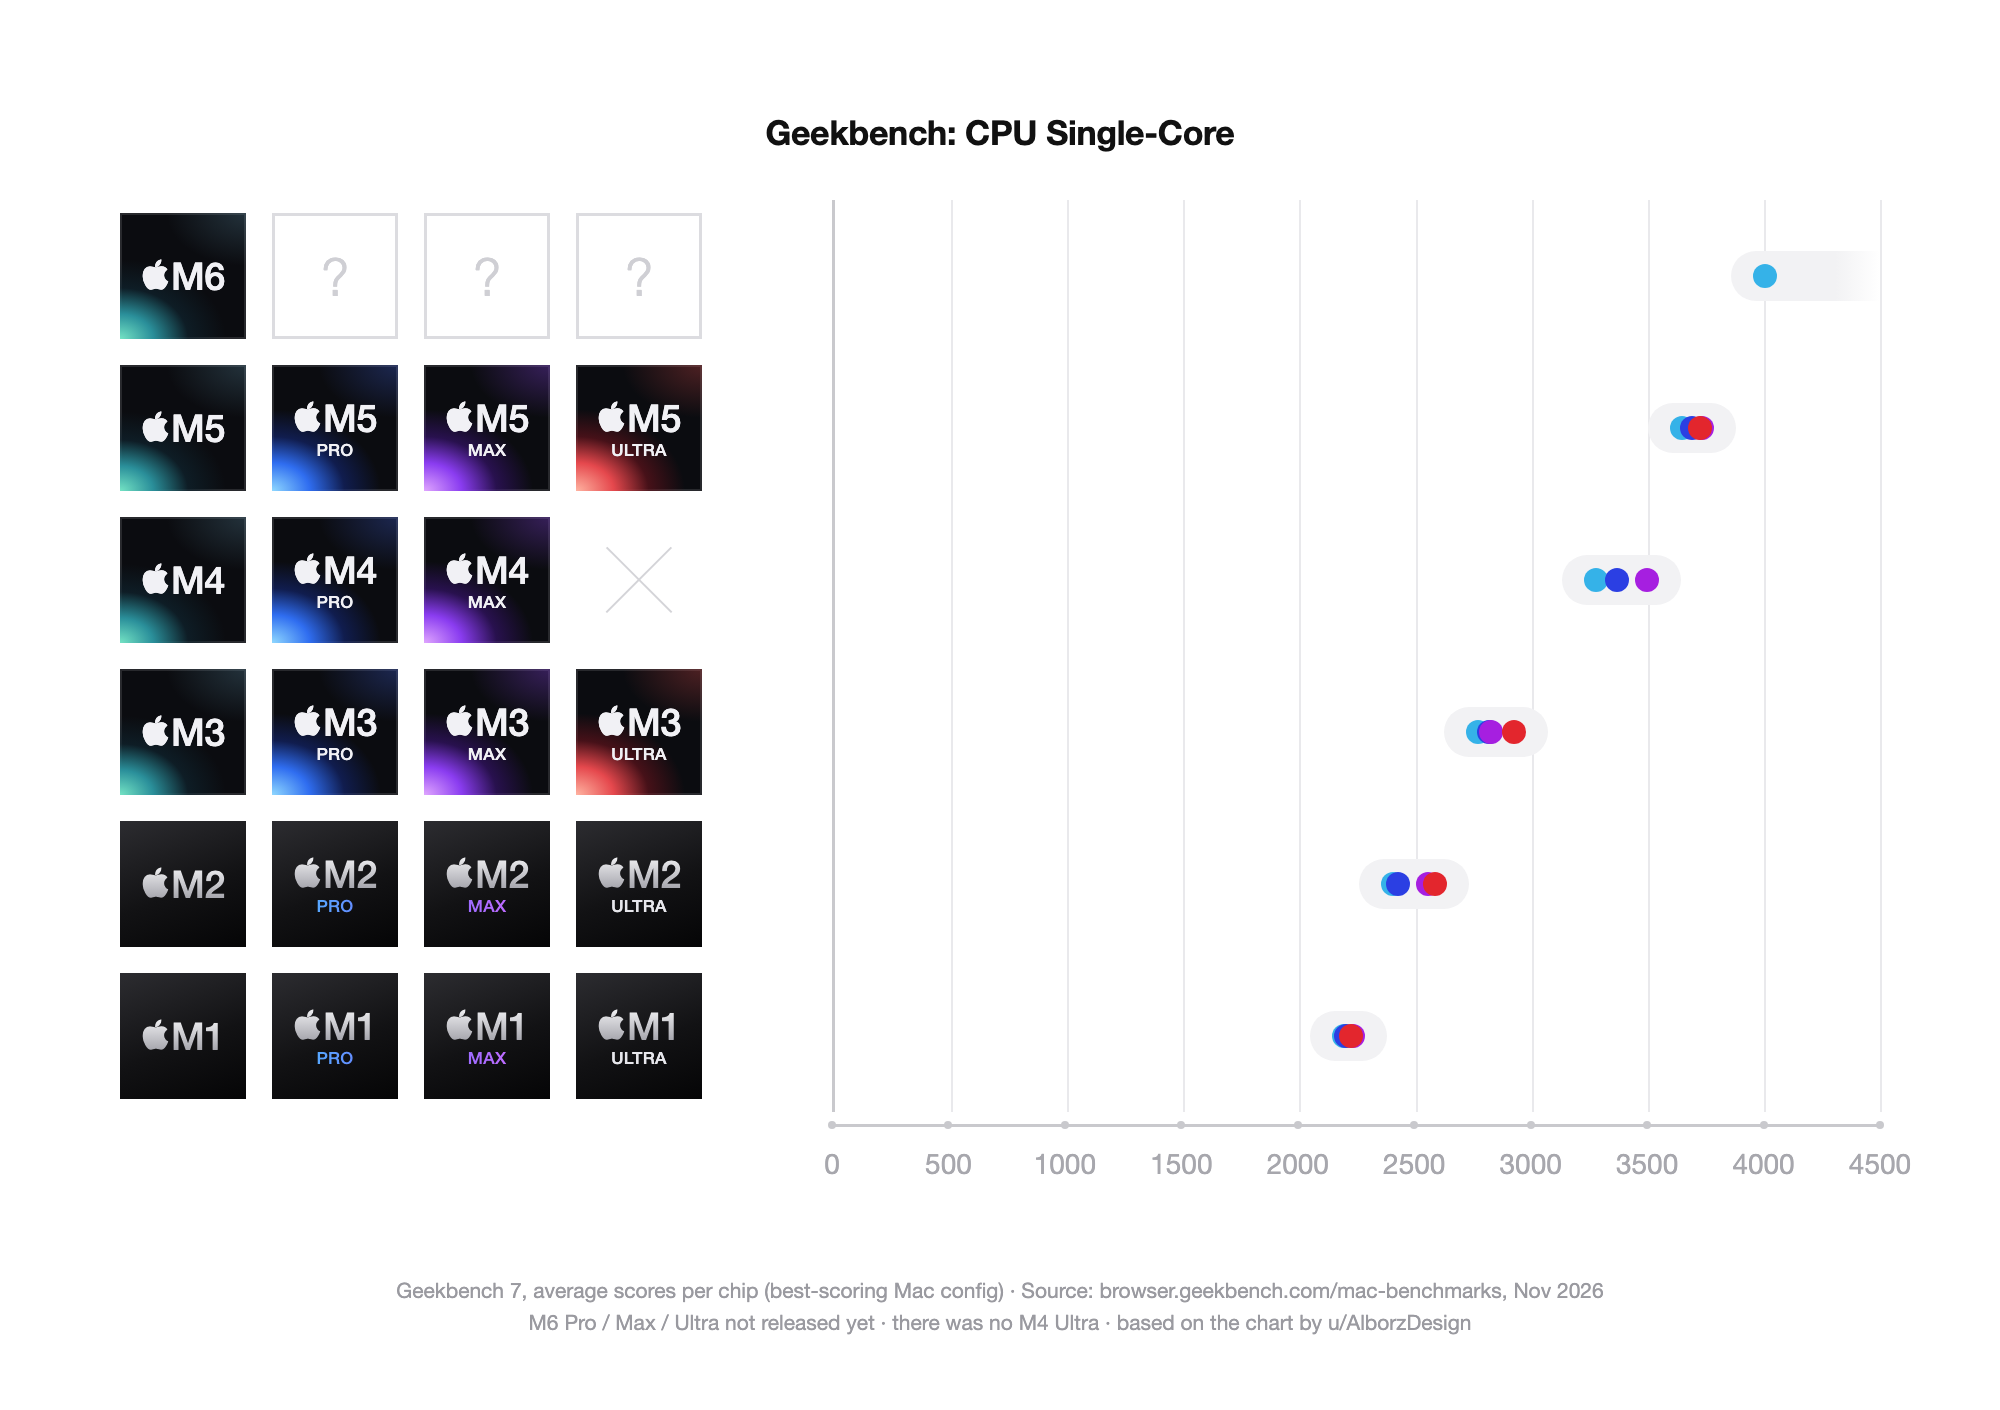
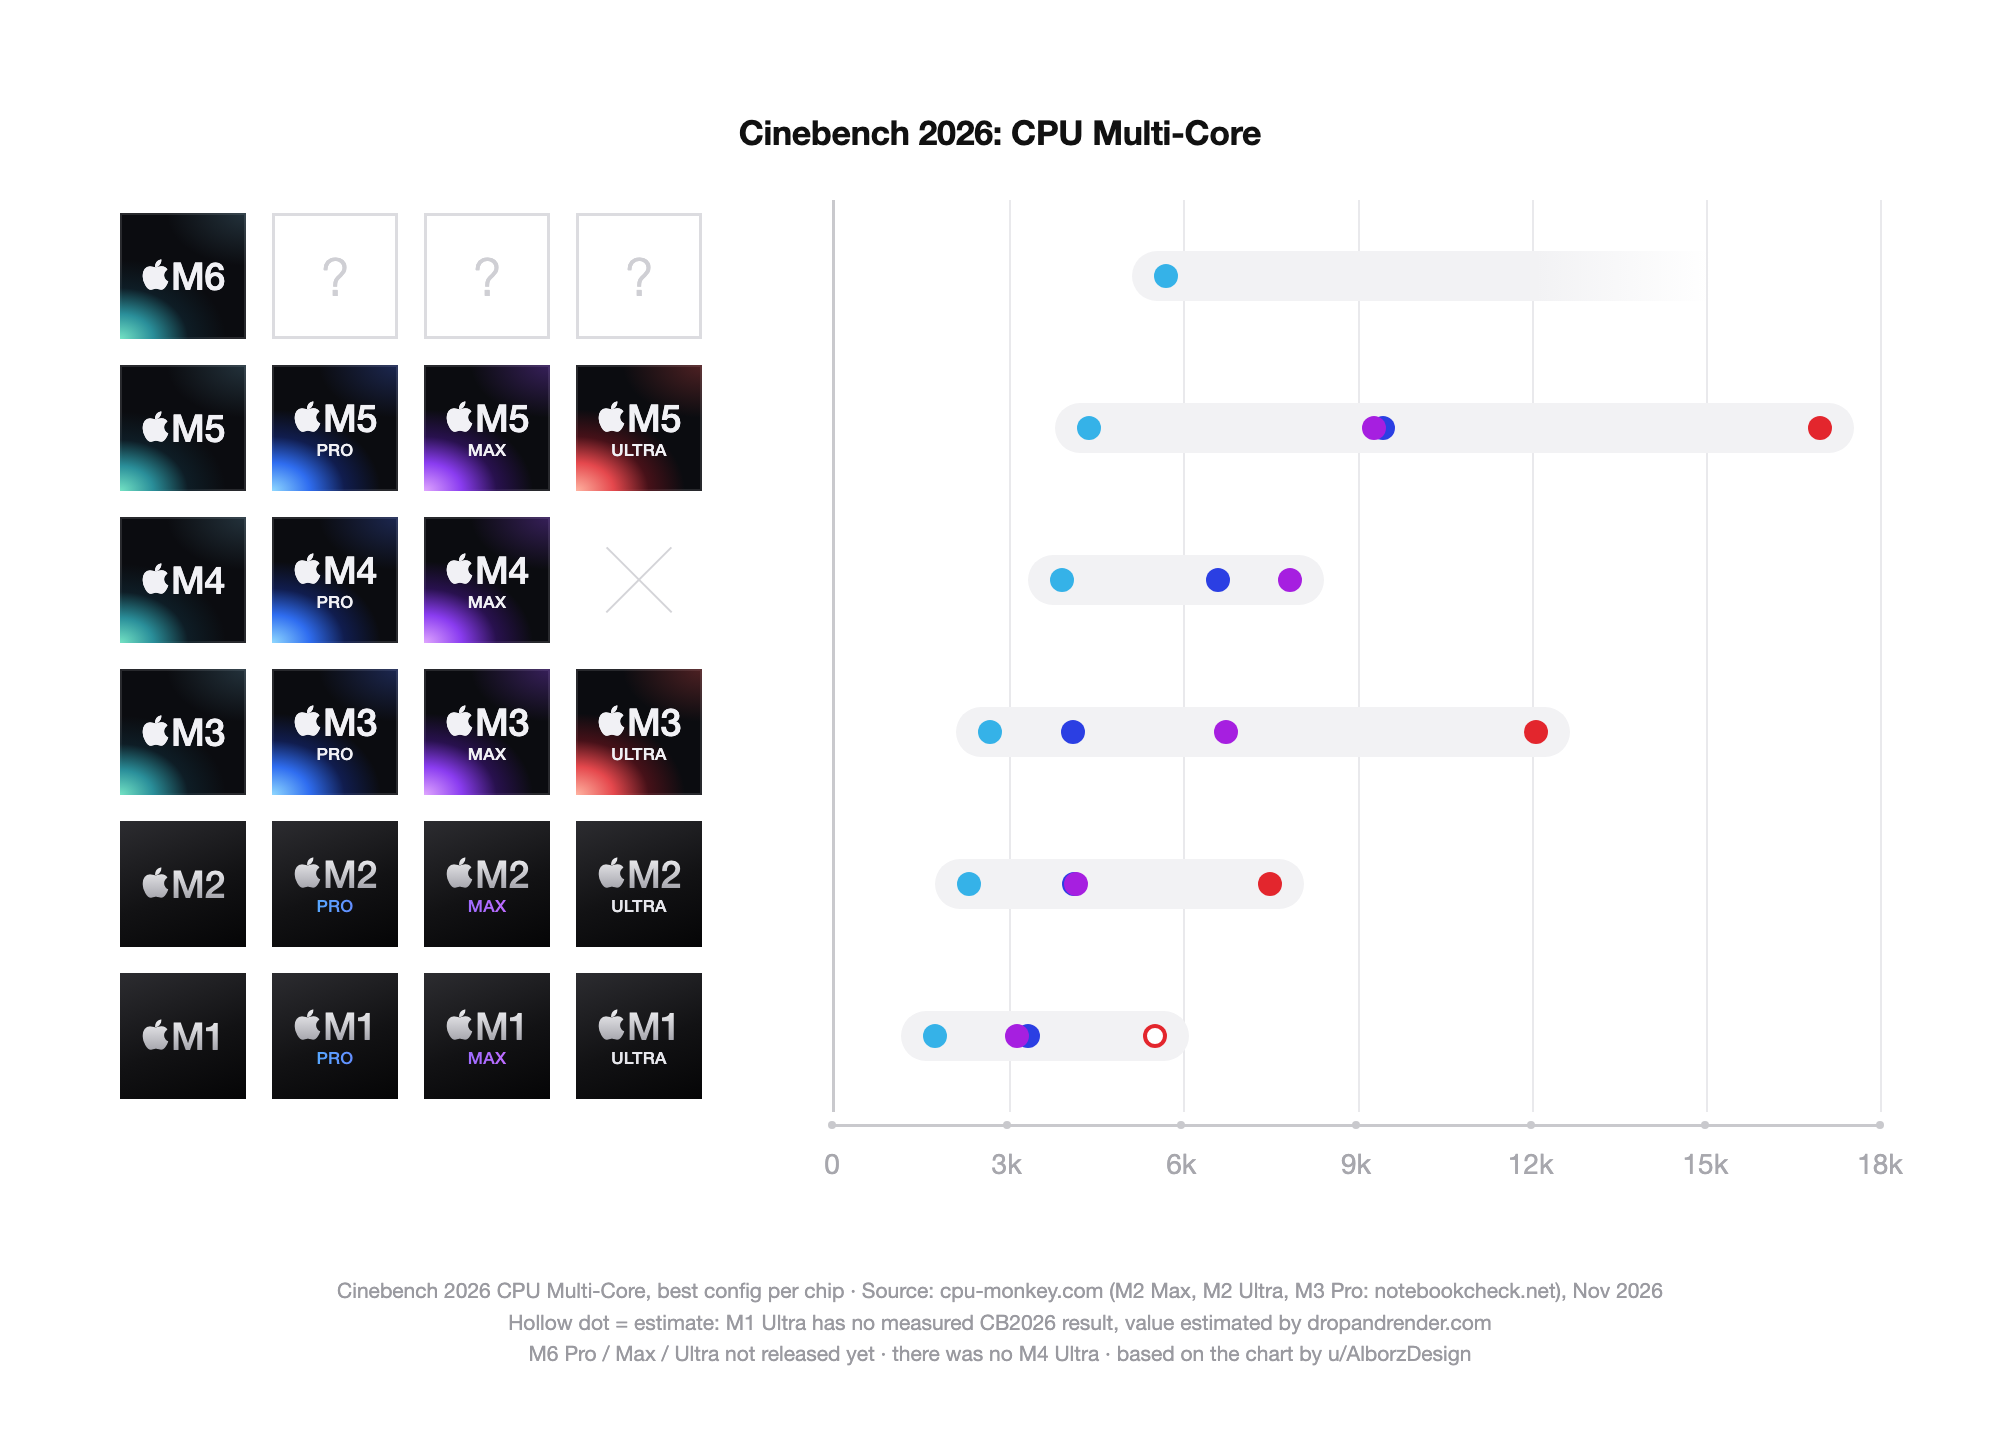
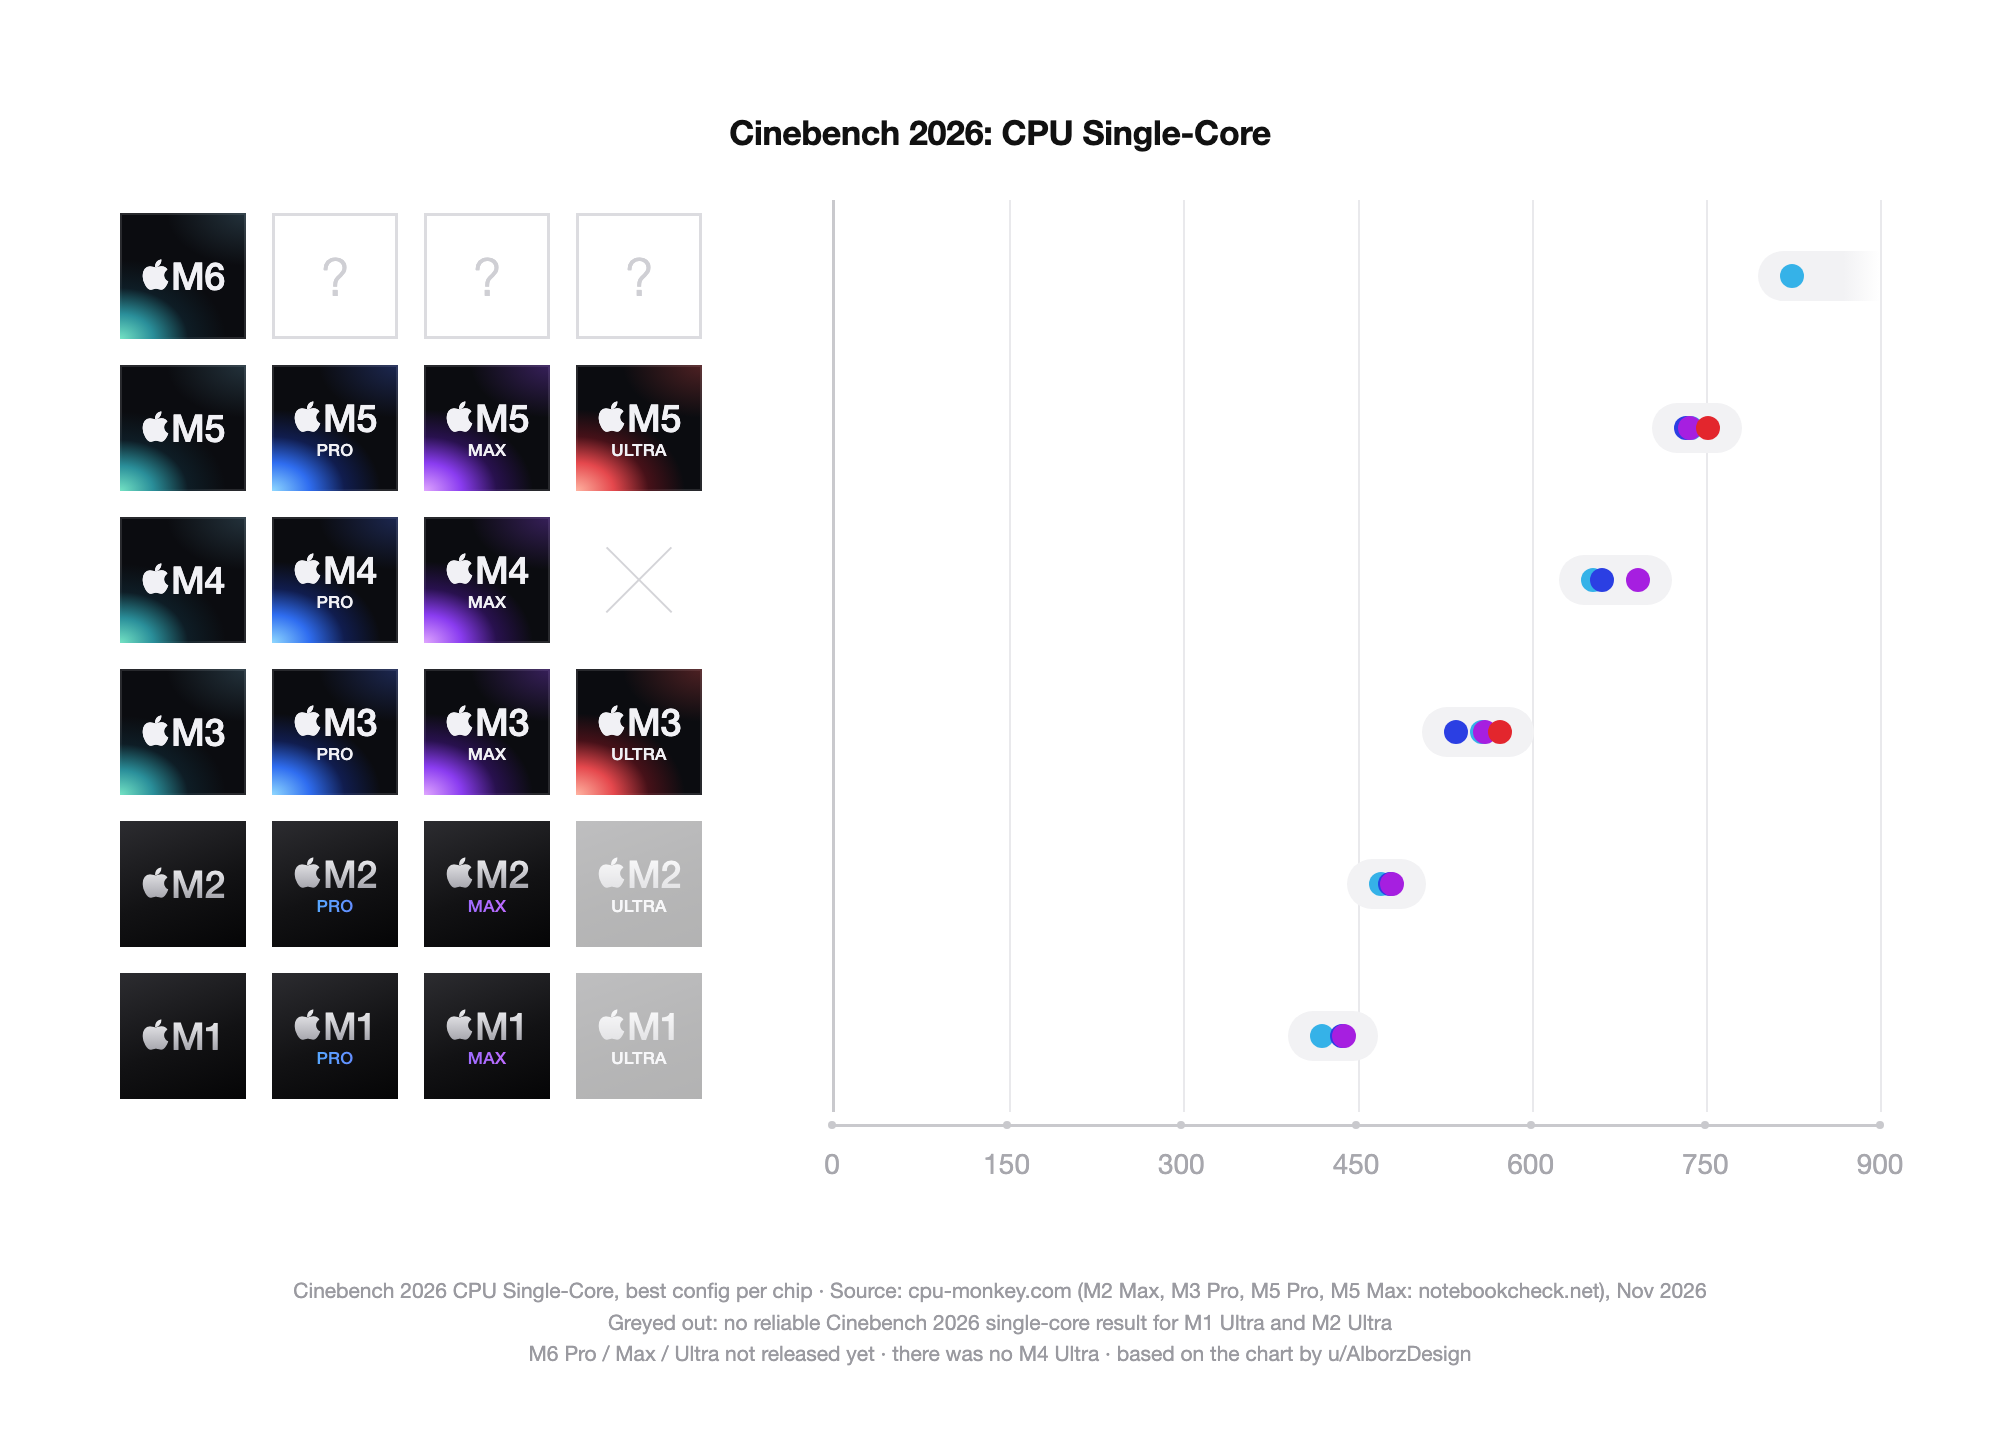
The base M6 scores 4,004 in Geekbench 7 single-core. The M1 scored 2,191. No M5 beats it either. The best M5, the Max, scores 3,733. Cinebench 2026 shows the same jump, 824 vs 419, almost exactly double.
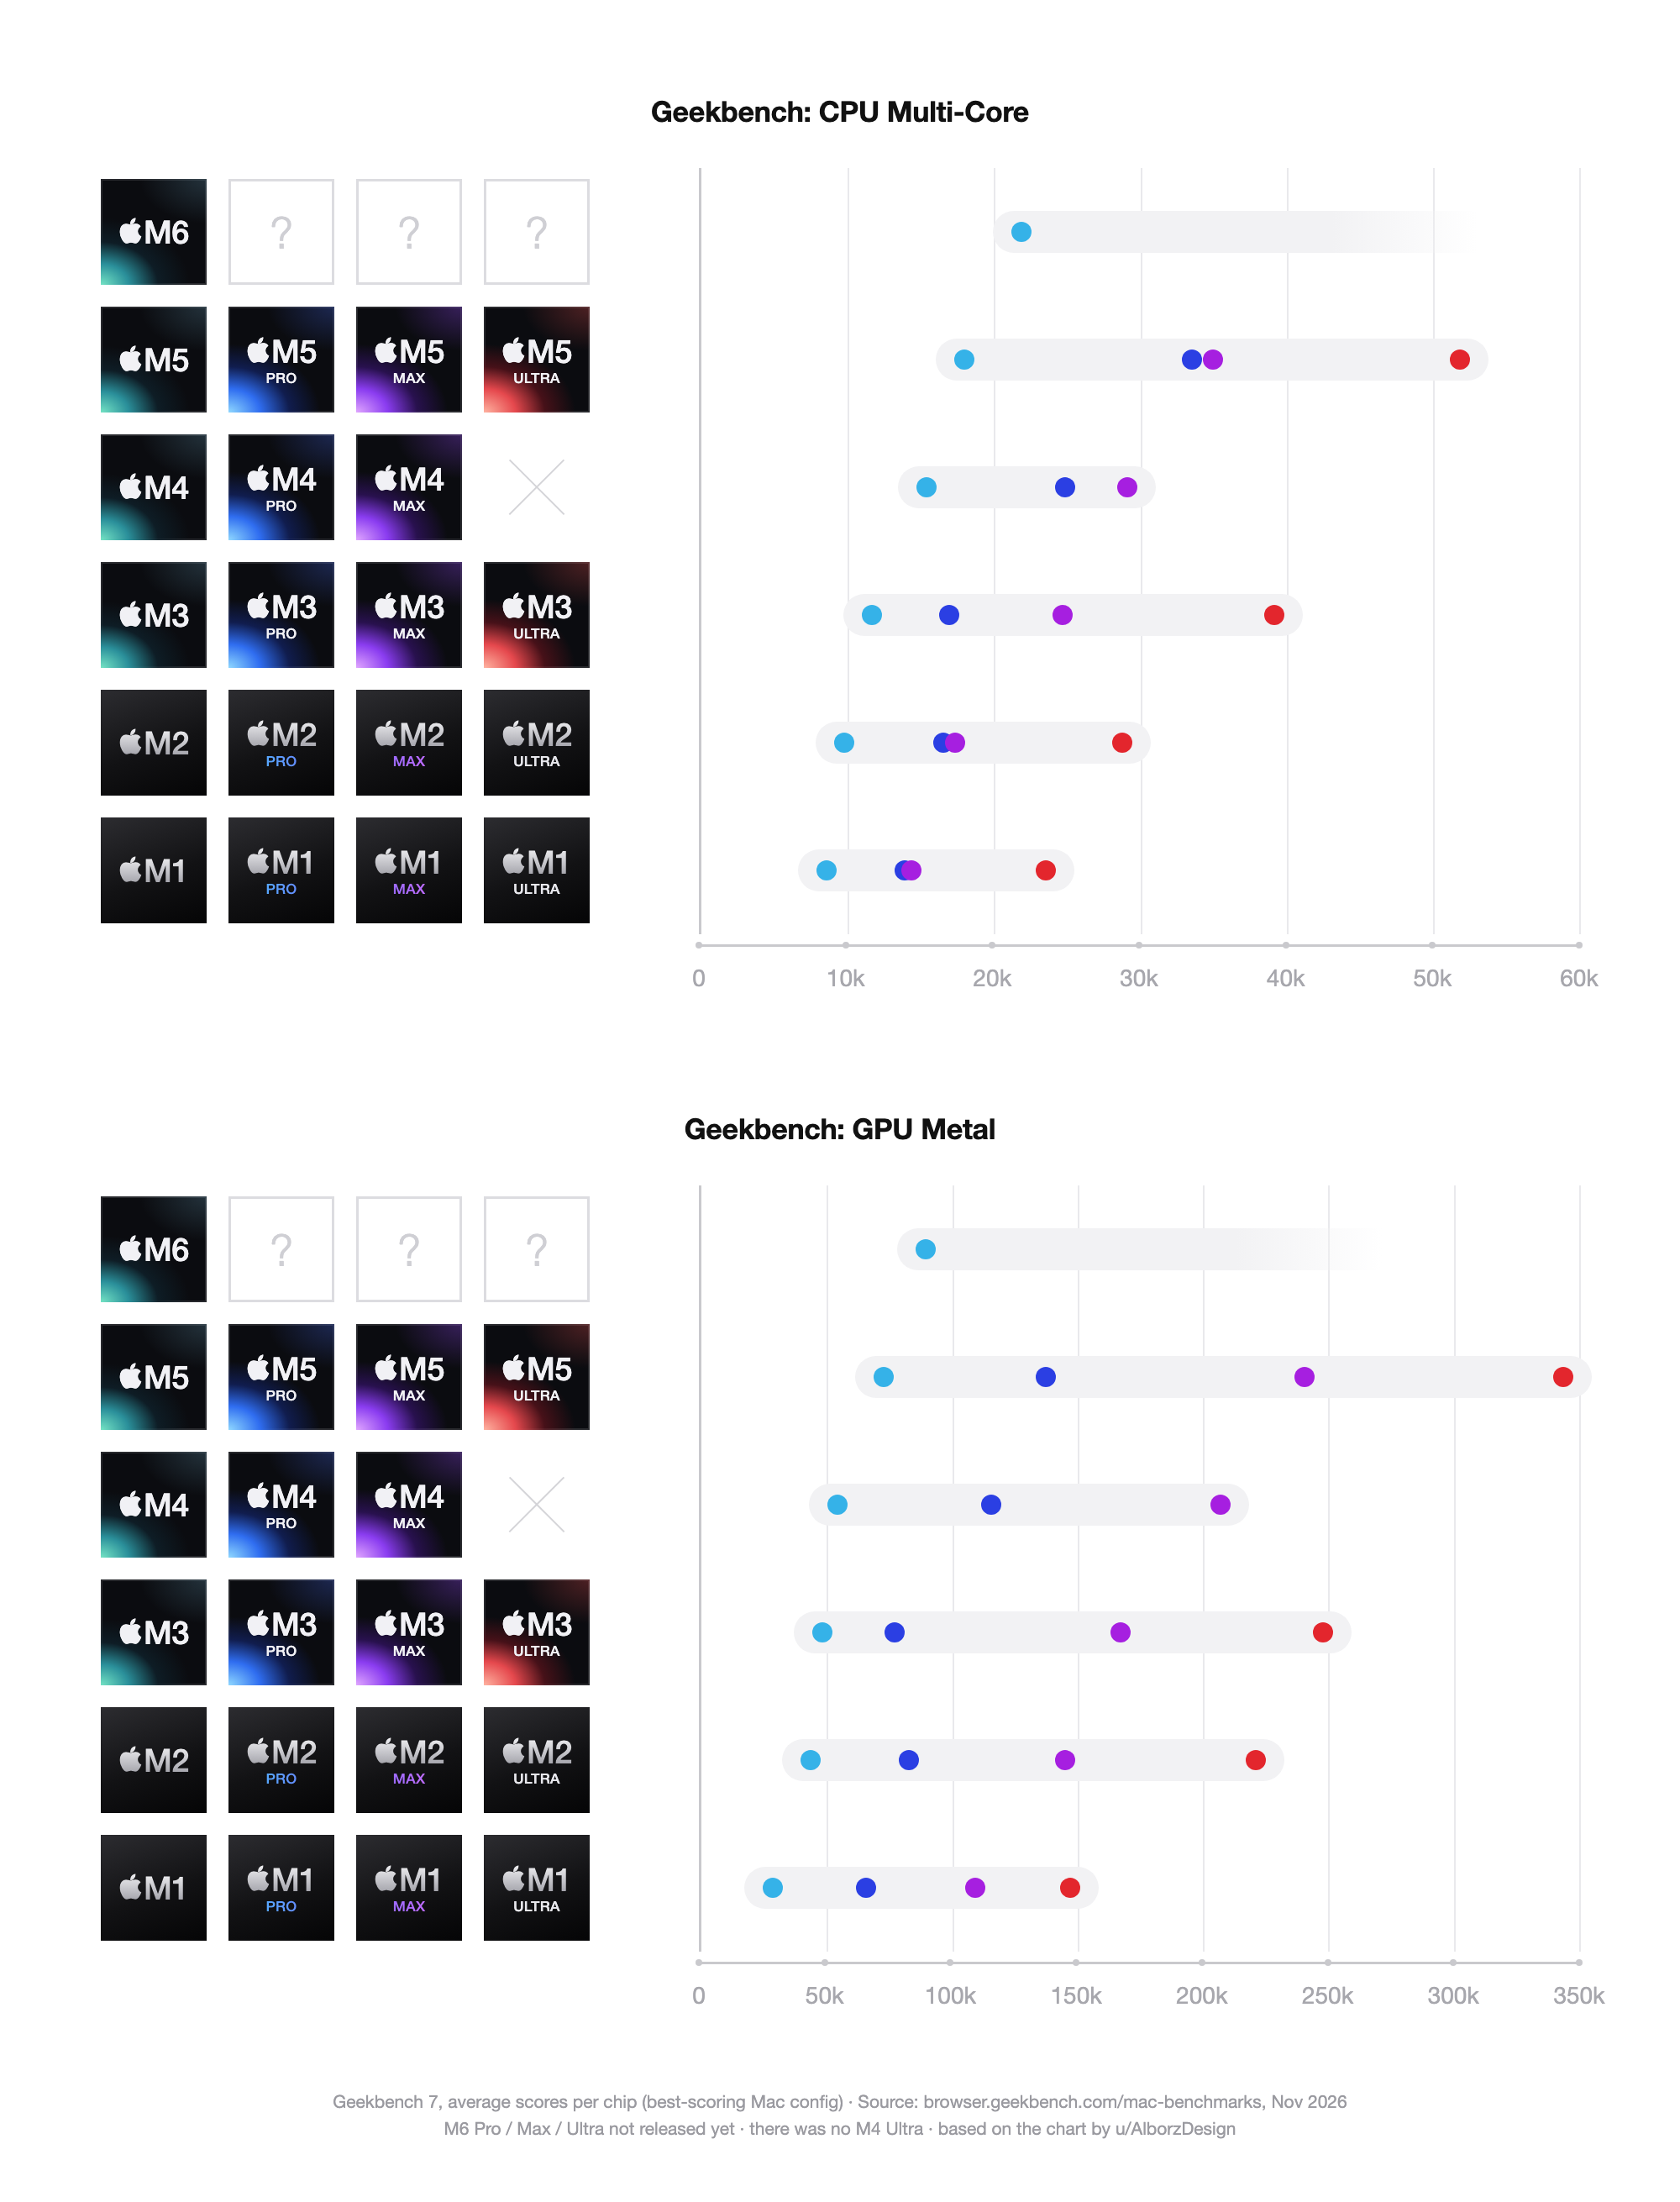
In multi-core the base M6 reaches 21,868. That beats every M1 and M2 Pro and Max, plus the M3 Pro. The M3 Max, the M4 Pro and every Ultra are still faster.
The M5 Ultra is the fastest chip for multi-core and GPU work. Over the M3 Ultra it gains 32% in Geekbench multi-core, 39% in Metal (343,652) and 40% in Cinebench 2026 (16,971). There's no M4 Ultra, so that jump covers two generations.
Base, Pro, Max and Ultra share the same CPU core design, and some of the bigger chips clock a little higher. A Max gets you more cores and a bigger GPU. It doesn't get you faster cores.
| Test | M6 | M5 | Diff |
|---|---|---|---|
| GB7 single | 4,004 | 3,649 | +10% |
| GB7 multi | 21,868 | 17,951 | +22% |
| GB7 Metal | 89,357 | 72,805 | +23% |
| CB2026 single | 824 | 737 | +12% |
| CB2026 multi | 5,705 | 4,367 | +31% |
| Test | M6 | M1 | Diff |
|---|---|---|---|
| GB7 single | 4,004 | 2,191 | +83% |
| GB7 multi | 21,868 | 8,551 | 2.6× |
| GB7 Metal | 89,357 | 28,496 | 3.1× |
| CB2026 single | 824 | 419 | +97% |
| CB2026 multi | 5,705 | 1,722 | 3.3× |
| Test | M5 | M4 | Diff |
|---|---|---|---|
| GB7 single | 3,649 | 3,278 | +11% |
| GB7 multi | 17,951 | 15,395 | +17% |
| GB7 Metal | 72,805 | 54,230 | +34% |
| CB2026 single | 737 | 653 | +13% |
| CB2026 multi | 4,367 | 3,908 | +12% |
| Test | M5 Pro | M4 Pro | Diff |
|---|---|---|---|
| GB7 single | 3,691 | 3,367 | +10% |
| GB7 multi | 33,554 | 24,835 | +35% |
| GB7 Metal | 137,290 | 115,619 | +19% |
| CB2026 single | 733 | 661 | +11% |
| CB2026 multi | 9,440 | 6,602 | +43% |
| Test | M5 Max | M4 Max | Diff |
|---|---|---|---|
| GB7 single | 3,733 | 3,497 | +7% |
| GB7 multi | 34,988 | 29,113 | +20% |
| GB7 Metal | 240,329 | 207,103 | +16% |
| CB2026 single | 736 | 692 | +6% |
| CB2026 multi | 9,278 | 7,830 | +18% |
| Test | M5 Ultra | M3 Ultra | Diff |
|---|---|---|---|
| GB7 single | 3,727 | 2,920 | +28% |
| GB7 multi | 51,848 | 39,139 | +32% |
| GB7 Metal | 343,652 | 247,973 | +39% |
| CB2026 single | 752 | 573 | +31% |
| CB2026 multi | 16,971 | 12,082 | +40% |
| Geekbench 7 | Geekbench 6 | Cinebench 2026 | Cinebench 2024 | |||||||
|---|---|---|---|---|---|---|---|---|---|---|
| Chip | Config | Single | Multi | Metal | Single | Multi | Single | Multi | Single | Multi |
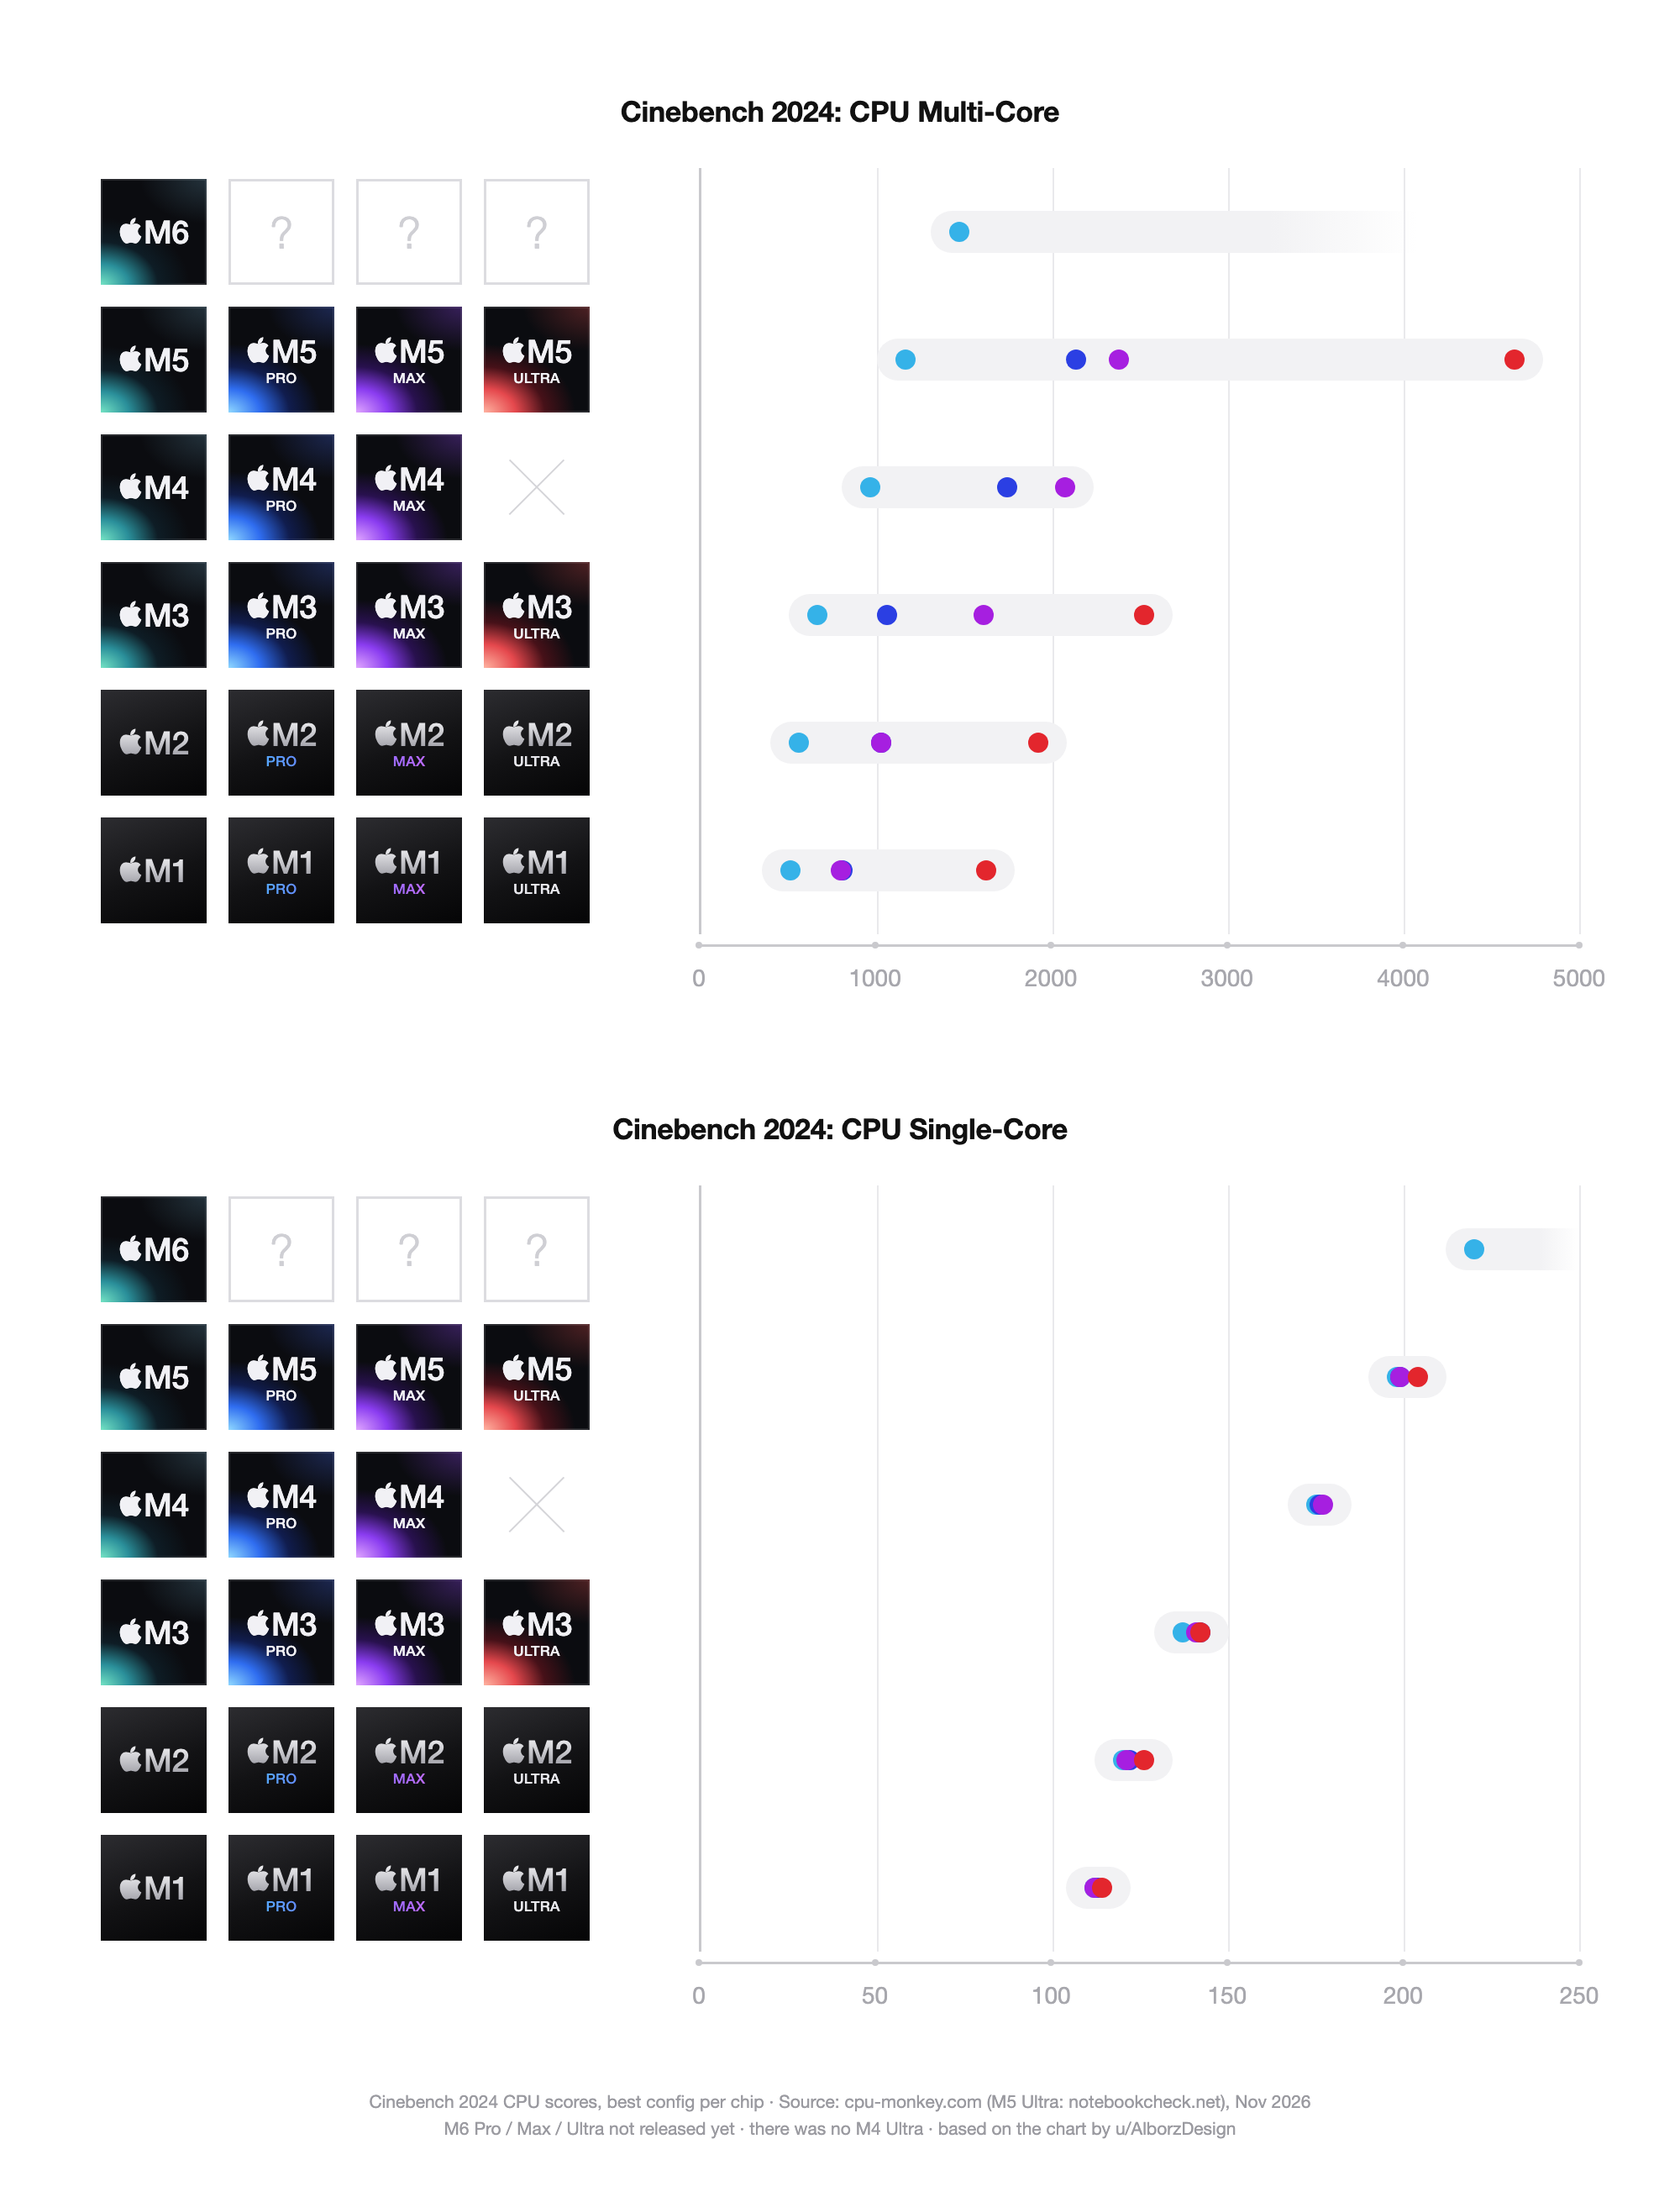
| Apple M6 | 12 CPU / 12 GPU | 4,004 | 21,868 | 89,357 | 4,654 | 20,989 | 824 | 5,705 | 220 | 1,470 |
| Apple M5 | 10 CPU / 10 GPU | 3,649 | 17,951 | 72,805 | 4,195 | 17,072 | 737 | 4,367 | 198 | 1,161 |
| Apple M5 Pro | 18 CPU / 20 GPU | 3,691 | 33,554 | 137,290 | 4,302 | 28,898 | 733 | 9,440 | 199 | 2,135 |
| Apple M5 Max | 18 CPU / 40 GPU | 3,733 | 34,988 | 240,329 | 4,322 | 29,256 | 736 | 9,278 | 199 | 2,377 |
| Apple M5 Ultra | 36 CPU / 80 GPU | 3,727 | 51,848 | 343,652 | 4,330 | 38,697 | 752 | 16,971 | 204 | 4,630 |
| Apple M4 | 10 CPU / 10 GPU | 3,278 | 15,395 | 54,230 | 3,749 | 14,988 | 653 | 3,908 | 175 | 962 |
| Apple M4 Pro | 14 CPU / 20 GPU | 3,367 | 24,835 | 115,619 | 3,882 | 22,527 | 661 | 6,602 | 176 | 1,742 |
| Apple M4 Max | 16 CPU / 40 GPU | 3,497 | 29,113 | 207,103 | 4,004 | 25,760 | 692 | 7,830 | 177 | 2,072 |
| Apple M3 | 8 CPU / 10 GPU | 2,771 | 11,646 | 48,180 | 3,054 | 11,966 | 557 | 2,672 | 137 | 659 |
| Apple M3 Pro | 12 CPU / 18 GPU | 2,816 | 16,944 | 77,083 | 3,138 | 15,480 | 535 | 4,100 | 142 | 1,059 |
| Apple M3 Max | 16 CPU / 40 GPU | 2,823 | 24,703 | 167,187 | 3,127 | 21,254 | 560 | 6,740 | 141 | 1,607 |
| Apple M3 Ultra | 32 CPU / 80 GPU | 2,920 | 39,139 | 247,973 | 3,240 | 28,170 | 573 | 12,082 | 142 | 2,520 |
| Apple M2 | 8 CPU / 10 GPU | 2,402 | 9,743 | 43,540 | 2,599 | 10,089 | 470 | 2,316 | 120 | 555 |
| Apple M2 Pro | 12 CPU / 19 GPU | 2,423 | 16,556 | 82,826 | 2,668 | 14,568 | 478 | 4,120 | 122 | 1,025 |
| Apple M2 Max | 12 CPU / 38 GPU | 2,553 | 17,316 | 145,172 | 2,692 | 14,863 | 480 | 4,150 | 121 | 1,025 |
| Apple M2 Ultra | 24 CPU / 76 GPU | 2,582 | 28,751 | 221,104 | 2,741 | 22,660 | – | 7,500 | 126 | 1,918 |
| Apple M1 | 8 CPU / 8 GPU | 2,191 | 8,551 | 28,496 | 2,363 | 8,622 | 419 | 1,722 | 112 | 509 |
| Apple M1 Pro | 10 CPU | 2,201 | 13,914 | 65,572 | 2,409 | 12,440 | 437 | 3,329 | 113 | 802 |
| Apple M1 Max | 10 CPU | 2,231 | 14,332 | 109,071 | 2,442 | 12,994 | 438 | 3,135 | 112 | 796 |
| Apple M1 Ultra | 20 CPU | 2,220 | 23,527 | 146,942 | – | – | – | 5,509* | 114 | 1,624 |
– means no reliable result, * means estimate. Config is the CPU and GPU core count of the top Geekbench 7 configuration. Geekbench doesn't report GPU cores for the M1 Pro, Max and Ultra.
Charts as PNG images. Geekbench 7 multi-core + Metal · Geekbench 7 single-core · Cinebench 2026 multi-core · Cinebench 2026 single-core · Cinebench 2024